This week I spent setting up a simple monitored set of virtualized Grails application servers. As my monitoring service I chose Zenoss.
Multi-Machine Setup with Vagrant
In order to simulate a production-like private network I created a multi-machine configuration for Vagrant comprising 3 machines:10.0.0.2is the installation target for the Zenoss server10.0.0.3and10.0.0.4are the two to-be-monitored application servers, each configured as a blue/green deployable Tomcat for hosting Grails applications

Vagrantfile
VAGRANTFILE_API_VERSION = "2"

Vagrant.configure(VAGRANTFILE_API_VERSION) do |config|
  config.vm.define "zenoss" do |zenoss_server|
    zenoss_server.vm.box = "CentOS-6.2-x86_64"
    zenoss_server.vm.box_url = "https://dl.dropboxusercontent.com/u/17905319/vagrant-boxes/CentOS-6.2-x86_64.box"

    zenoss_server.vm.network :private_network, ip: "10.0.0.2"
    # ...
  end

  (1..2).each do |idx|
    config.vm.define "grails#{idx}" do |grails_web|
      grails_web.vm.box = "squeezy"
      grails_web.vm.box_url = "https://dl.dropboxusercontent.com/u/17905319/vagrant-boxes/squeezy.box"

      grails_web.vm.network :private_network, ip: "10.0.0.#{2 + idx}"
      # ...
    end
  end
end
Installing the Zenoss server
All the machines are provisioned with Chef. For the server, there is a dedicated role inroles/zenoss_server.rb.
Besides filling the run list with the zenoss::server recipe, it configures various attributes for Java and the Zenoss installation.
Vagrantfile
  config.vm.define "zenoss" do |zenoss_server|
    # ...
    zenoss_server.vm.provision :chef_solo do |chef|
      # ...
      chef.add_role "zenoss_server"
      # ...

      chef.json = {
        domain: "localhost"
      }
    end
  end
roles/zenoss_server.rb
name "zenoss_server"
description "Configures the Zenoss monitoring server"

default_attributes(
  "zenoss" => {
    "device" => {
      "properties" => {
        "zCommandUsername" => "zenoss",
        "zKeyPath" => "/home/zenoss/.ssh/id_dsa",
        "zMySqlPassword" => "zenoss",
        "zMySqlUsername" => "zenoss"
      }
    }
  }
)

override_attributes(
  "java" => {
    "install_flavor" => "oracle",
    "jdk_version" => "7",
    "oracle" => {
      "accept_oracle_download_terms" => true
    }
  },
  "zenoss" => {
    "server" => {
      "admin_password" => "zenoss"
    },
    "core4" => {
      "rpm_url" => "http://downloads.sourceforge.net/project/zenoss/zenoss-4.2/zenoss-4.2.4/4.2.4-1897/zenoss_core-4.2.4-1897.el6.x86_64.rpm?r=http%3A%2F%2Fsourceforge.net%2Fprojects%2Fzenoss%2Ffiles%2Fzenoss-4.2%2Fzenoss-4.2.4%2F4.2.4-1897%2F&ts=1392587207&use_mirror=skylink"
    },
    "device" => {
      "device_class" => "/Server/SSH/Linux"
    }
  }
)

run_list(
  "recipe[zenoss::server]"
)
Installing the Application Servers
In order to prepare an application server for monitoring, you have to install the SNMP daemon. The Simple Network Management Protocol provides insights into various system parameters like CPU utilization, disk usage, RAM statistics. I bundled my common run list and attributes inroles/monitored.rb
Vagrantfile
  (1..2).each do |idx|
    config.vm.define "grails#{idx}" do |grails_web|
      # ...
      grails_web.vm.provision :chef_solo do |chef|
        # ...
        chef.add_role   "monitored"

        chef.json = {
          domain: "localhost",
        }
      end
    end
  end
roles/monitored.rb
name "monitored"
description "Bundles settings for nodes monitored by Zenoss"

default_attributes()

override_attributes(
  "snmp" => {
    "snmpd" => {
      "snmpd_opts" => '-Lsd -Lf /dev/null -u snmp -g snmp -I -smux -p /var/run/snmpd.pid'
    },
    "full_systemview" => true,
    "include_all_disks" => true
  }
)

run_list(
  "recipe[snmp]"
)
Signing up the Application Servers for Monitoring
Now we must acquaint the Application Servers with Zenoss. As a first step, I did this manually via the Zenoss Web UI. The Web UI is only reachable through the server's loopback interface. To make it accessible from my browser, I tunneled HTTP traffic to the loopback device via SSH:
Terminal
ssh -p 2222 -o "UserKnownHostsFile /dev/null" -o "StrictHostKeyChecking no" -N -L 8080:127.0.0.1:8080 root@localhost
# Password is `vagrant'
Logging in with the credentials from
roles/zenoss_server.rb, we can access the dashboard: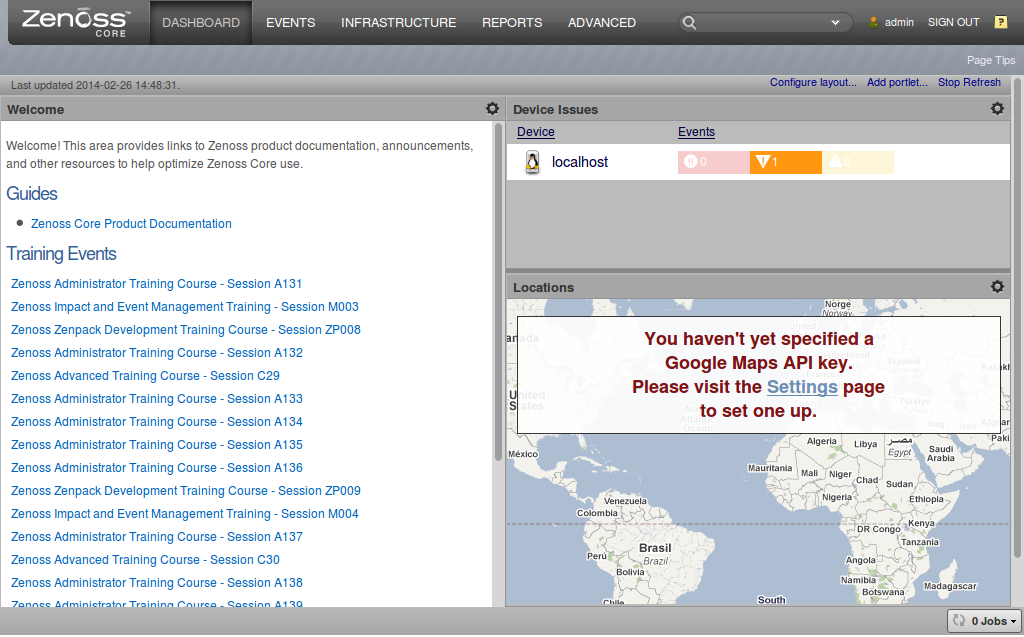
Switching over to the
Infrastructure tab, we can Add Multiple Devices:
We input the IP addresses of our two virtual app servers,
10.0.0.3 and 10.0.0.4, and keep the default value for the device type, Linux Server (SNMP).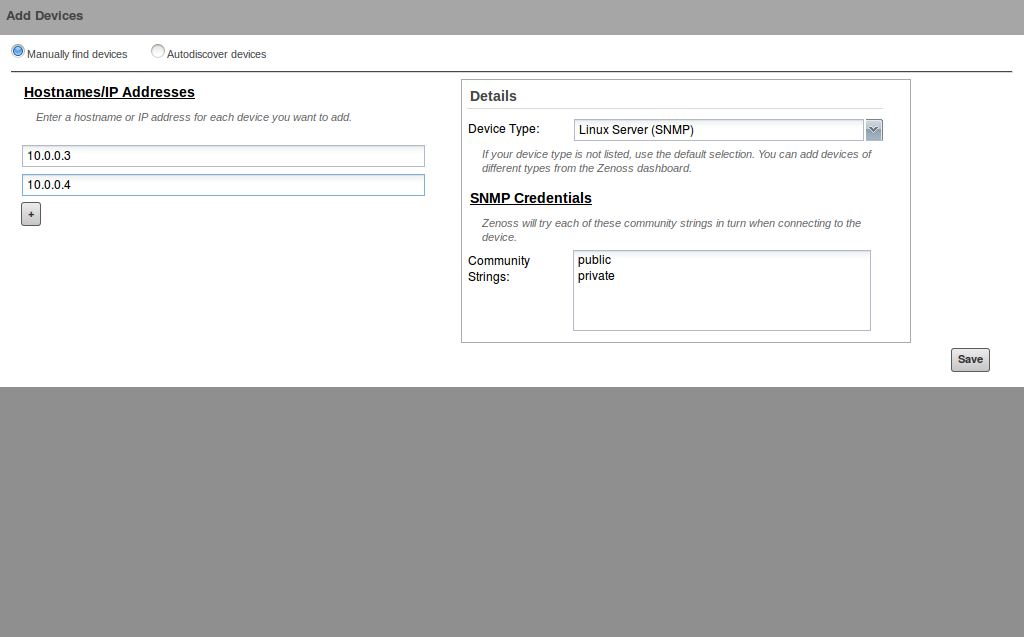
Now, Zenoss adds these two nodes to its server pool in the background:

Having finished this, Zenoss starts recording events and measurements of the nodes. This is an example from a simple load scenario of a Grails application on node
grails2, 10.0.0.4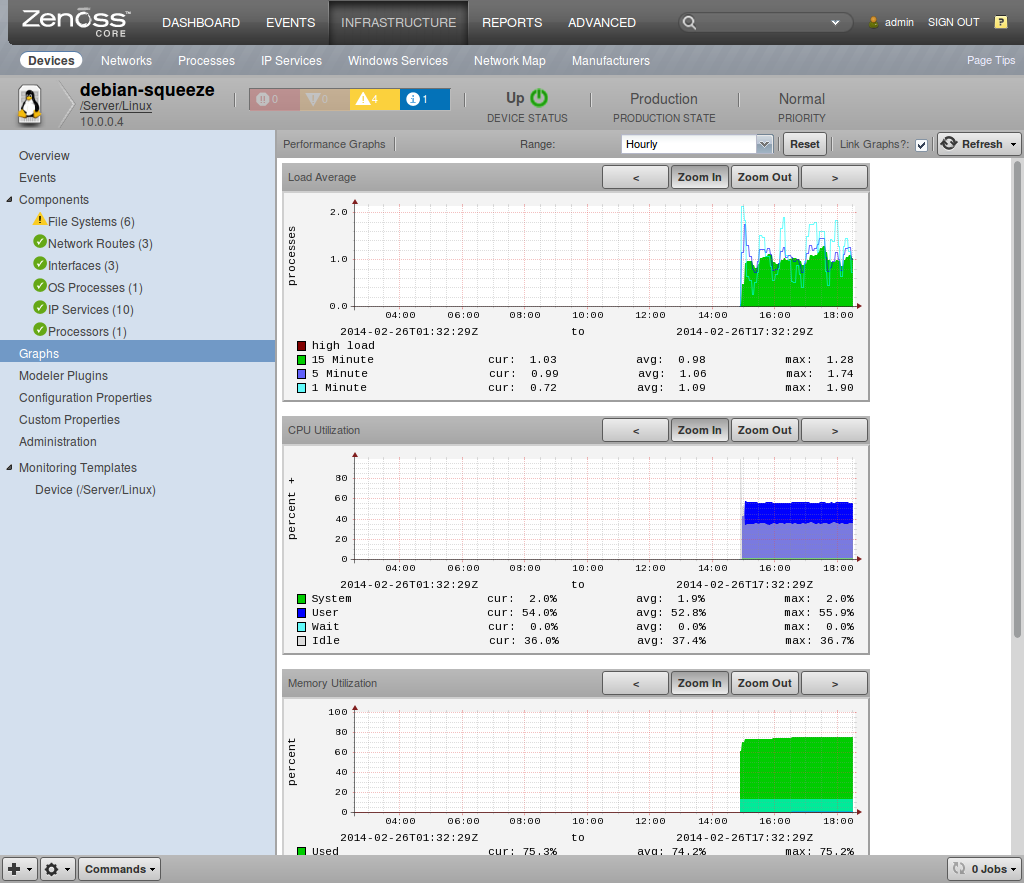
Now you are prepared for further exploration of the server performance jungle. All my sources are available from GitHub.
Keine Kommentare:
Kommentar veröffentlichen